MoroccoMA
Why speed tests disagree: turn different numbers into useful evidence
1. Define the disagreement before trying to fix it
×Write down the exact comparison that troubles you. Is the same website changing between consecutive runs? Does a phone disagree with a laptop? Is one testing service consistently faster than another? Does a file download look slow despite a strong test result? These are different investigations. If you change the device, website, connection mode, and location together, you cannot tell which change explains the difference. Give the investigation one question that a small number of observations could reasonably answer.
Connect that question to a real symptom. A frozen meeting requires attention to responsiveness and interruptions, while a long backup concerns upload capacity and completion. A large download result does not establish that every application is performing well. Conversely, one low browser result does not prove that an otherwise successful call needs fixing. Record the affected activity, approximate time, device, and location alongside the numbers. This makes the comparison relevant to your situation rather than a competition between meters.
Keep the original observation, including an unexpected high or low value. Do not begin by assuming that a provider is cheating or a website is inaccurate. A repeatable measurement can still describe a different path. Choose a next step that separates explanations rather than merely producing another number.
2. Follow the measurement path, not just the provider name
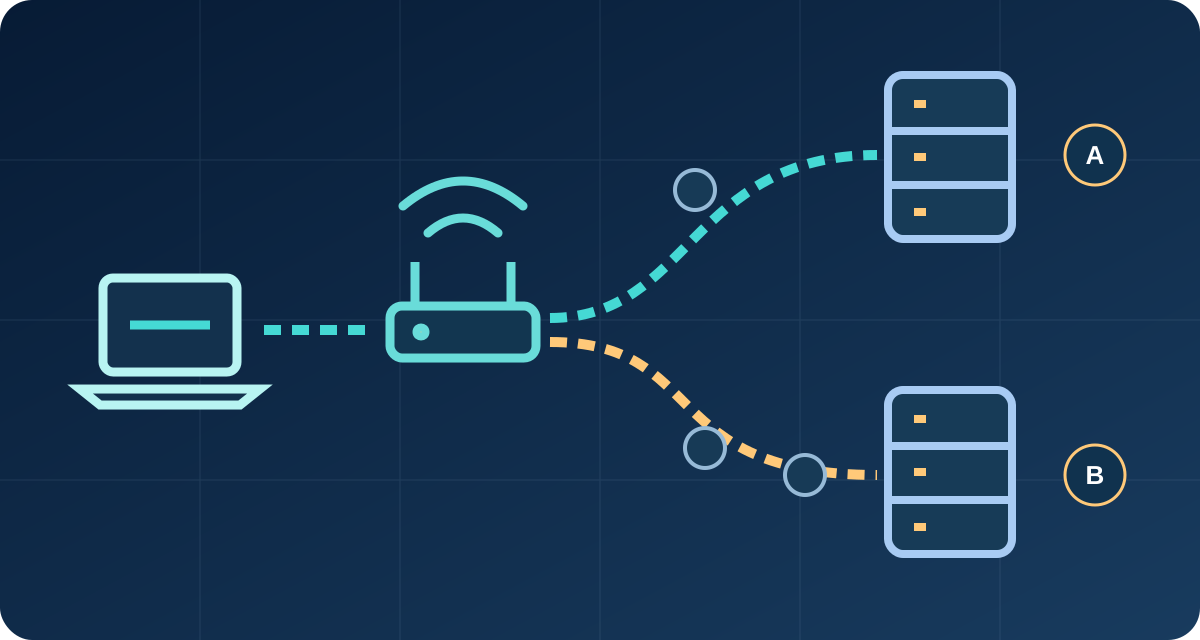
×A browser test passes through your device, its local network connection, a router or mobile access network, networks beyond that access connection, and a measurement endpoint. The value is an observation of that combined journey. A provider label describes only part of it. Keeping the same provider therefore does not guarantee an identical experiment: a device can move between wireless bands, a VPN can select another exit, and a testing service can select another destination without the provider name changing.
Distance is one possible explanation for different delay, but a map is not a complete route diagram. Nearby destinations do not necessarily use identical interconnections, and a familiar server label can represent a distributed service rather than one permanent physical machine. Record the server information actually displayed; do not invent a city or server address when it is unavailable. If the interface says nearest edge, preserve that description and recognize that it does not certify a fixed location across all runs.
Consider a browser speed test that performs well while a remote work application remains slow. Both observations matter because they concern different destinations and workloads. Do not dismiss the application problem because the meter looks healthy. A useful next comparison is whether that application behaves differently on another authorized connection.
3. Compare methods before comparing the final numbers
×Measurement services make different design choices about destinations, request sizes, duration, connections, and summary calculations. Their results are not automatically interchangeable because both use Mbps. Cloudflare documents a browser timing based measurement engine with configurable request sequences and summary settings. M-Lab describes NDT as a single stream bulk transport measurement. These are reasons to read the method, not reasons to declare one service universally correct. Keep each service's results in a separate series before attempting to explain a difference between them.
The current InternetSpeedGeo main test configures three approximately ten second windows: latency, download, then upload. Each uses a finite request sequence; requests may finish before that phase's display window ends. This configuration does not directly measure packet loss or latency while the connection is loaded. The separate Ping page times HTTP requests to this website, which is a different destination from the main test. A smooth animation is presentation, not additional evidence that traffic flowed continuously or every network property was measured.
Record the service, method, and server where available. Keep older results from another engine distinguishable: a method change can affect a before and after comparison. Do not combine an unloaded latency reading, a game's latency, and the separate HTTP Ping tool into one average. They do not measure the same path.
4. Set a small test budget and a stopping rule
×Plan the tests before pressing Start. For an initial investigation, a small series of separate runs under one condition can reveal whether the result is stable enough to compare. Decide which single change you will try afterward and what outcome would help. Do not leave an unlimited loop running or keep repeating a test because the latest value is disappointing. Repetition has a cost in data, time, and contention with other people, and a long unplanned sequence can become harder to interpret.
Check whether your connection is metered, roaming, shared through a phone, or subject to a limited allowance. A short looking timer does not mean negligible data use. This guide does not promise an exact consumption figure because the actual request completion and connection conditions vary. If allowance is limited, start with configuration checks and existing records, then decide whether another active measurement is worth it. Watch the allowance using the network provider's or device's own reporting, understanding that updates may not be immediate.
Choose a stopping rule: finish the baseline, make one reversible change, compare, and stop when you have a next action. Stop earlier if a call is disrupted, the device overheats, the allowance becomes a concern, or the test repeatedly fails. Note a failure separately instead of entering an endless retry cycle.
5. Build a baseline that another person could reproduce
×Use the same device, browser, connection mode, and physical position for the baseline. Keep power settings and VPN state unchanged. Pause your own large transfers where possible, and ask permission before affecting shared equipment. Do not disconnect other people or stop their work for a cleaner score. Note activity you cannot control, such as a television streaming elsewhere. A baseline can still be useful with that limitation recorded; an incorrectly labelled idle connection is more misleading than an honestly described shared one.
Run only one speed test at a time across the connection. Wait for it to complete or cancel before opening another service. Keep the test tab visible and avoid starting updates, moving rooms, or changing network settings during the run. Record the full result rather than only the biggest number: date, time zone, download, upload, latency, available jitter, method, and server. Also note whether the device was wired, using home Wi-Fi, or using mobile data. These labels prevent unrelated observations being mistaken for one series.
Leave time between tests to confirm completion and record conditions; no universal pause certifies comparability. If two tests accidentally overlap, mark both records and exclude them from the controlled baseline with that reason visible. Exclusion based on a known condition is different from deleting whichever result you dislike.
6. Worked example: similar medians, very different consistency
×Consider two hypothetical download series, expressed in Mbps. Series A contains 92, 95, and 180. Series B contains 92, 94, and 95. These are invented teaching values, not live results from this site. Sorting A gives a middle value, or median, of 95; its range is 180 minus 92, which is 88. Sorting B gives a median of 94 and a range of 3. The typical middle readings are close, but A is much less consistent within this tiny set.
The largest value alone would tell a different story: A reached 180 while B never exceeded 95. That is true within the example but insufficient to claim that condition A provides reliably greater capacity. The mean of A is about 122.3, compared with about 93.7 for B, illustrating how one unusually high reading can pull a small series upward. Neither summary explains why the high reading occurred. A note about the connection, destination, and household activity is still needed before forming a useful hypothesis.
The next action is not to erase 180 or celebrate it as the true speed. Check whether that run used a different band, device, destination, VPN state, or background workload. If no difference is known, call it an unexplained observation and keep it. Another small, planned comparison may help if the answer would change your next action. This example supports comparing both the center and spread of a series; it does not define a universal acceptable range or rank real providers.
Similar medians, very different variation
Hypothetical teaching data — not your readings or provider averages.
| Series | Readings (Mbps) | Median (Mbps) | Spread: maximum − minimum (Mbps) |
|---|---|---|---|
| A | 92 / 95 / 180 | 95 | 88 |
| B | 92 / 94 / 95 | 94 | 3 |
7. Use summaries honestly, including their limits
×For an odd number of observations, the median is the middle value after sorting. For an even number, it is the average of the two middle values. The range is the maximum minus the minimum. Calculate download, upload, and latency separately rather than blending incompatible units. A median is a compact description of your recorded series, not a promise about tomorrow. A narrow range over a few tests describes those tests only; it cannot establish that an intermittent fault never happens.
Do not use the same word for different kinds of variation. The spread between completed download tests is not latency jitter. Jitter concerns changes in delay samples within a defined measurement method, while a range across completed runs describes differences between those runs. Likewise, a minimum and maximum are not a confidence interval. You can communicate the useful observation plainly: the recorded download readings were close together, or they varied widely, under the conditions listed. Avoid statistical certainty unsupported by the sample size and sampling method.
InternetSpeedGeo compares a limited recent set only when required context matches. Missing metadata does not establish identical conditions, and matching server labels cannot guarantee a fixed physical destination. If comparison is unavailable, preserve better context next time. Retain individual readings and exclusions with your calculations so someone else can verify the summary.
8. Separate a destination difference from an ordering effect
×Suppose one testing service always seems faster. Start by checking that both use the same device and connection and that they do not overlap. Then compare their results as two labelled groups, not one mixed average. If affordable and relevant, alternate the order on a later pair of tests. A service tested only first may benefit from a different moment of household activity than a service always tested second. Changing the order cannot remove every confounder, but it prevents one simple pattern from going unnoticed.
Keep the comparison modest. Do not deliberately overwhelm the connection with several websites to see which wins. A simultaneous test changes the workload for all participants and no longer represents the original question. Also avoid repeatedly selecting endpoints until one produces a preferred score. When manual server selection is available, record the choice and compare the same choices again. When it is automatic, acknowledge that limit. A consistent difference between labelled services is evidence of a repeatable difference in that setup, not proof of its cause.
If ordinary downloads and the affected application work while one testing destination looks poor, investigate destination or method differences before buying equipment. Several poor activities instead suggest a broader issue. Distinguish observation from attribution: service A repeatedly reads lower is an observation; an interconnection is congested remains a hypothesis.
9. Investigate time patterns without inventing a daily trend
×A busy evening and a quiet morning are different conditions. If the original symptom has a time pattern, schedule a small comparison at those relevant times rather than testing constantly throughout the day. Keep the device, position, connection mode, and measurement service the same. Record household use as well as the clock. Otherwise, the apparent evening pattern may simply reflect a backup that runs then. Include the time zone when sharing results so the support team can understand which local period you mean.
One bad evening is not enough to establish a recurring daily pattern. Where the data allowance and your schedule permit, check whether the same distinction returns on another day. Keep the full short series for each period rather than selecting the fastest morning run and slowest evening run. Compare like summaries and retain the spread. If the pattern disappears, report that too. An intermittent issue is not made clearer by hiding contradictory evidence; the circumstances of a good period can help narrow the explanation.
An evening pattern could involve access capacity, household demand, radio conditions, routing, or the endpoint. Try an authorized wired comparison with household transfers paused. If the issue remains, send dated records for investigation. Your home sample cannot establish intentional throttling or describe everyone in the neighborhood.
10. Check the device and local link before replacing the service
×When a phone and laptop disagree, you changed more than the screen displaying the test. The devices can use different radios, adapters, browsers, power settings, background workloads, and local links. First compare each device repeatedly in a stable position. If only one stays slow, investigate that device and its connection before concluding the entire service is slow. A second device is helpful evidence, but the comparison is not a controlled test of the browser alone unless the other relevant differences are addressed.
For Wi-Fi, compare the usual location with a position nearer the router while keeping the same device and service. If Ethernet is available, check that traffic actually uses the cable and that the adapter and port are suitable for the intended comparison. A wired link has its own limits; it is not automatically an unlimited reference. Keep local link speed and measured internet throughput separately labelled. An operating system's connection rate does not establish the rate of useful data delivered across the entire internet path.
Change one reversible condition: move the device, use an existing sound cable, or close a demanding application. Do not disable security protections indiscriminately or reset equipment without a restoration plan. Consult manufacturer guidance for suspected adapter, power, or thermal limitations before buying replacements. Replacing several components together makes the cause harder to identify.
11. Treat VPN and mobile changes as separate experiments
×A VPN can change the route, exit location, processing workload, and apparent network identity. Compare its enabled and disabled states only where you are authorized to do so and where disabling it is safe for the task. A work VPN may be required by policy; do not bypass it to improve a score. If a comparison is permitted, keep the same device and testing service, record the exit selection, and separate the two series. A different result cannot by itself distinguish encryption overhead from route or endpoint differences.
Do not change the VPN country, switch to mobile data, and move to another room within one supposed comparison. Each change introduces another explanation. A mobile connection also needs its own context, such as whether the device was stationary, indoors, or sharing data through a hotspot. Avoid testing while driving or in any situation requiring attention elsewhere. Record what the device actually reports instead of inferring radio technology or available capacity from a provider name or a marketing label.
A faster VPN result demonstrates a difference, not intentional provider throttling; a slower result does not identify a defective VPN. If the problem exists only within a work tunnel, report the application symptom and labelled measurements to your administrator. Remove private exit and organization details from public screenshots.
12. Interpret responsiveness separately from download capacity
×A fast download and an uncomfortable video call can coexist because capacity and responsiveness describe different aspects of a connection. Look at upload and delay as well as download, but keep the measurement limitations in view. This site's main latency phase precedes its transfer phases; it is not a direct loaded latency measurement. The independent Ping tool uses another destination. Neither result is a substitute for the affected application's own diagnostics when you are investigating a particular meeting service or game.
Start with an observation about activity: does the symptom appear while another device uploads, or does it remain when the household connection is quiet? If you can safely pause the competing transfer, note whether the symptom improves. This is a practical comparison, not a claim that the speed test has measured packet loss or router queues. Avoid staging a heavy transfer during someone else's important call just to provoke a failure. The affected person's description and timestamps can be enough to decide the next check.
Result guidance is triage, not a quality certificate. Editorial thresholds suggest investigation, while applications have different requirements and endpoints. Choose a next step: compare idle Ethernet, examine background uploads, check application status, or provide a dated report. A warning does not locate the faulty component, and an unavailable metric is not a reassuring zero.
13. Record failures, cancellations, and missing values correctly
×A test that fails to return a valid measurement has not measured zero speed. Possible explanations include a blocked request, a lost connection, a browser interruption, or an unavailable endpoint, but the failure message alone may not distinguish them. Keep the failure time and the visible message. Check whether normal pages or the affected application still work. If they do, describe the problem as a failed measurement rather than a proven total outage. Do not enter invented numbers so a chart looks complete.
A cancelled run should remain separate from a completed result. If you close the active test, wait until it stops before beginning another. If you suspect it has continued transmitting or the interface is stuck, close the test page and investigate instead of layering another measurement over it. When changing networks, start a fresh run under a clearly identified condition. Combining latency from one network with throughput from another creates a result that no longer represents the path described by its label.
Missing historical metadata also deserves honest treatment. An old reading without a reliable date, server, or connection mode may still be a personal note, but it is a weaker basis for a controlled comparison. Preserve the original information without guessing missing details. When exporting a report, distinguish unavailable values from measured zeros and list which records were excluded from a summary. This small discipline prevents an incomplete record from becoming a confident but false story about how your connection changed.
14. Do not mistake provider aggregates for your household baseline
×An average from other visitors answers a different question from repeated tests on your device. People choose when to test, and they may be more likely to test when something is wrong or after buying a faster plan. Devices, plans, radio conditions, locations, methods, and household demand can differ. A recognizable provider name does not remove those differences. Treat a provider table as a description of accepted submissions within its stated scope, not as an independently representative survey of every customer.
Read the sample count, time window, connection grouping, and method notes before drawing a conclusion. A small group can change substantially after a few submissions. Mixing historical methods can introduce another source of variation. A current page does not imply that every underlying observation was collected today. Likewise, selecting a country or moving a map does not create verified measurements for every street. No available sample should remain no available sample; a directory listing is not evidence of measured speed.
Use your controlled baseline for troubleshooting and your actual service terms for a plan discussion. Beating a national average does not resolve a recurring local fault. For a purchase, investigate availability and limitations at the intended address. A voluntary aggregate is neither a performance guarantee nor evidence of coverage.
15. Choose the next action from the pattern you actually observed
×If only distant Wi-Fi is repeatedly poor while the same device performs better nearby, investigate coverage and the local wireless environment. If only one device remains poor in comparable locations, inspect that device and its link. If wired and nearby wireless observations are both poor across more than one suitable device, investigate shared household activity and the broader connection. These branches narrow the search; none alone proves a specific hardware failure. Follow the smallest reversible action that can separate the remaining explanations.
If different testing destinations disagree consistently but normal activities work, retain the labelled series and investigate method or route differences rather than chasing the highest value. If only a particular application remains poor, check its own diagnostics and support information. If the problem recurs at specific times, retain comparable records from those periods. When nothing forms a stable pattern, describe the uncertainty and stop testing until another observation could answer a concrete question. More data without a question can create noise rather than clarity.
Repeat the relevant comparison after a change and record whether the original symptom improved. A larger number is not a repair if the call still freezes. Conversely, a modest change can help if the task becomes dependable. Keep before and after evidence together and disclose other intervening changes.
16. Share a concise report, then stop when the question is answered
×A useful support report begins with the symptom and its impact, followed by the conditions and individual results. State what you changed, what stayed constant, and what remains uncertain. Include the test service, displayed server, date and time zone, device, connection mode, VPN state, and relevant background activity. Supply the small series rather than a cropped single maximum or minimum. If you calculated a median or range, name the metric and unit and keep the source readings available for verification.
You can use this plain language template: The problem is [activity and symptom]. It occurred at [times and time zone] on [device and connection]. I used [service and displayed server] with [VPN state and household activity]. The separate completed readings were [results with units]. I then changed only [condition], and observed [results and symptom]. Runs excluded from the comparison were [records and reasons]. Please investigate [specific remaining question]. Brackets are fields to complete, not claims that you already collected the evidence.
Before sharing, remove account numbers, precise home addresses, public IP information, or unrelated personal details that the recipient does not need. Send private diagnostics through an appropriate support channel rather than publishing them indiscriminately. Keep a copy of your own records and ask what further observation would help before starting another long test session. The investigation is complete when it supports a useful action, demonstrates that the issue is resolved, or clearly identifies what an authorized support team must investigate next.
References and further reading
×Overview
Two different speed readings can both be genuine. The useful question is not which website produces the largest number, but what changed between the measurements and whether that difference explains the problem you experience. This guide provides a repeatable comparison method, a worked example using medians and ranges, and a practical report you can send for support. All numerical examples are hypothetical teaching cases, not customer measurements, provider rankings, or promised performance. Begin with a small, deliberate test plan rather than repeatedly testing until an attractive result appears.